1. What Trip Weather does
Analysing the weather at a fixed point is one thing. But underway you are not standing still: you cross different areas at different times. A strong-wind corridor at Cap Sicié may be calm two hours earlier if you pass through in the early morning.
Solano's Trip Weather answers this question: what weather will I encounter along my whole itinerary, hour by hour?
The principle: you draw waypoints on the map, you enter a travel speed and a departure time, and Solano computes when you'll be at each point. The weather is then interpolated linearly between the waypoints for each available model — wind, gusts, direction, waves, currents.
2. Turning on the mode and drawing the itinerary
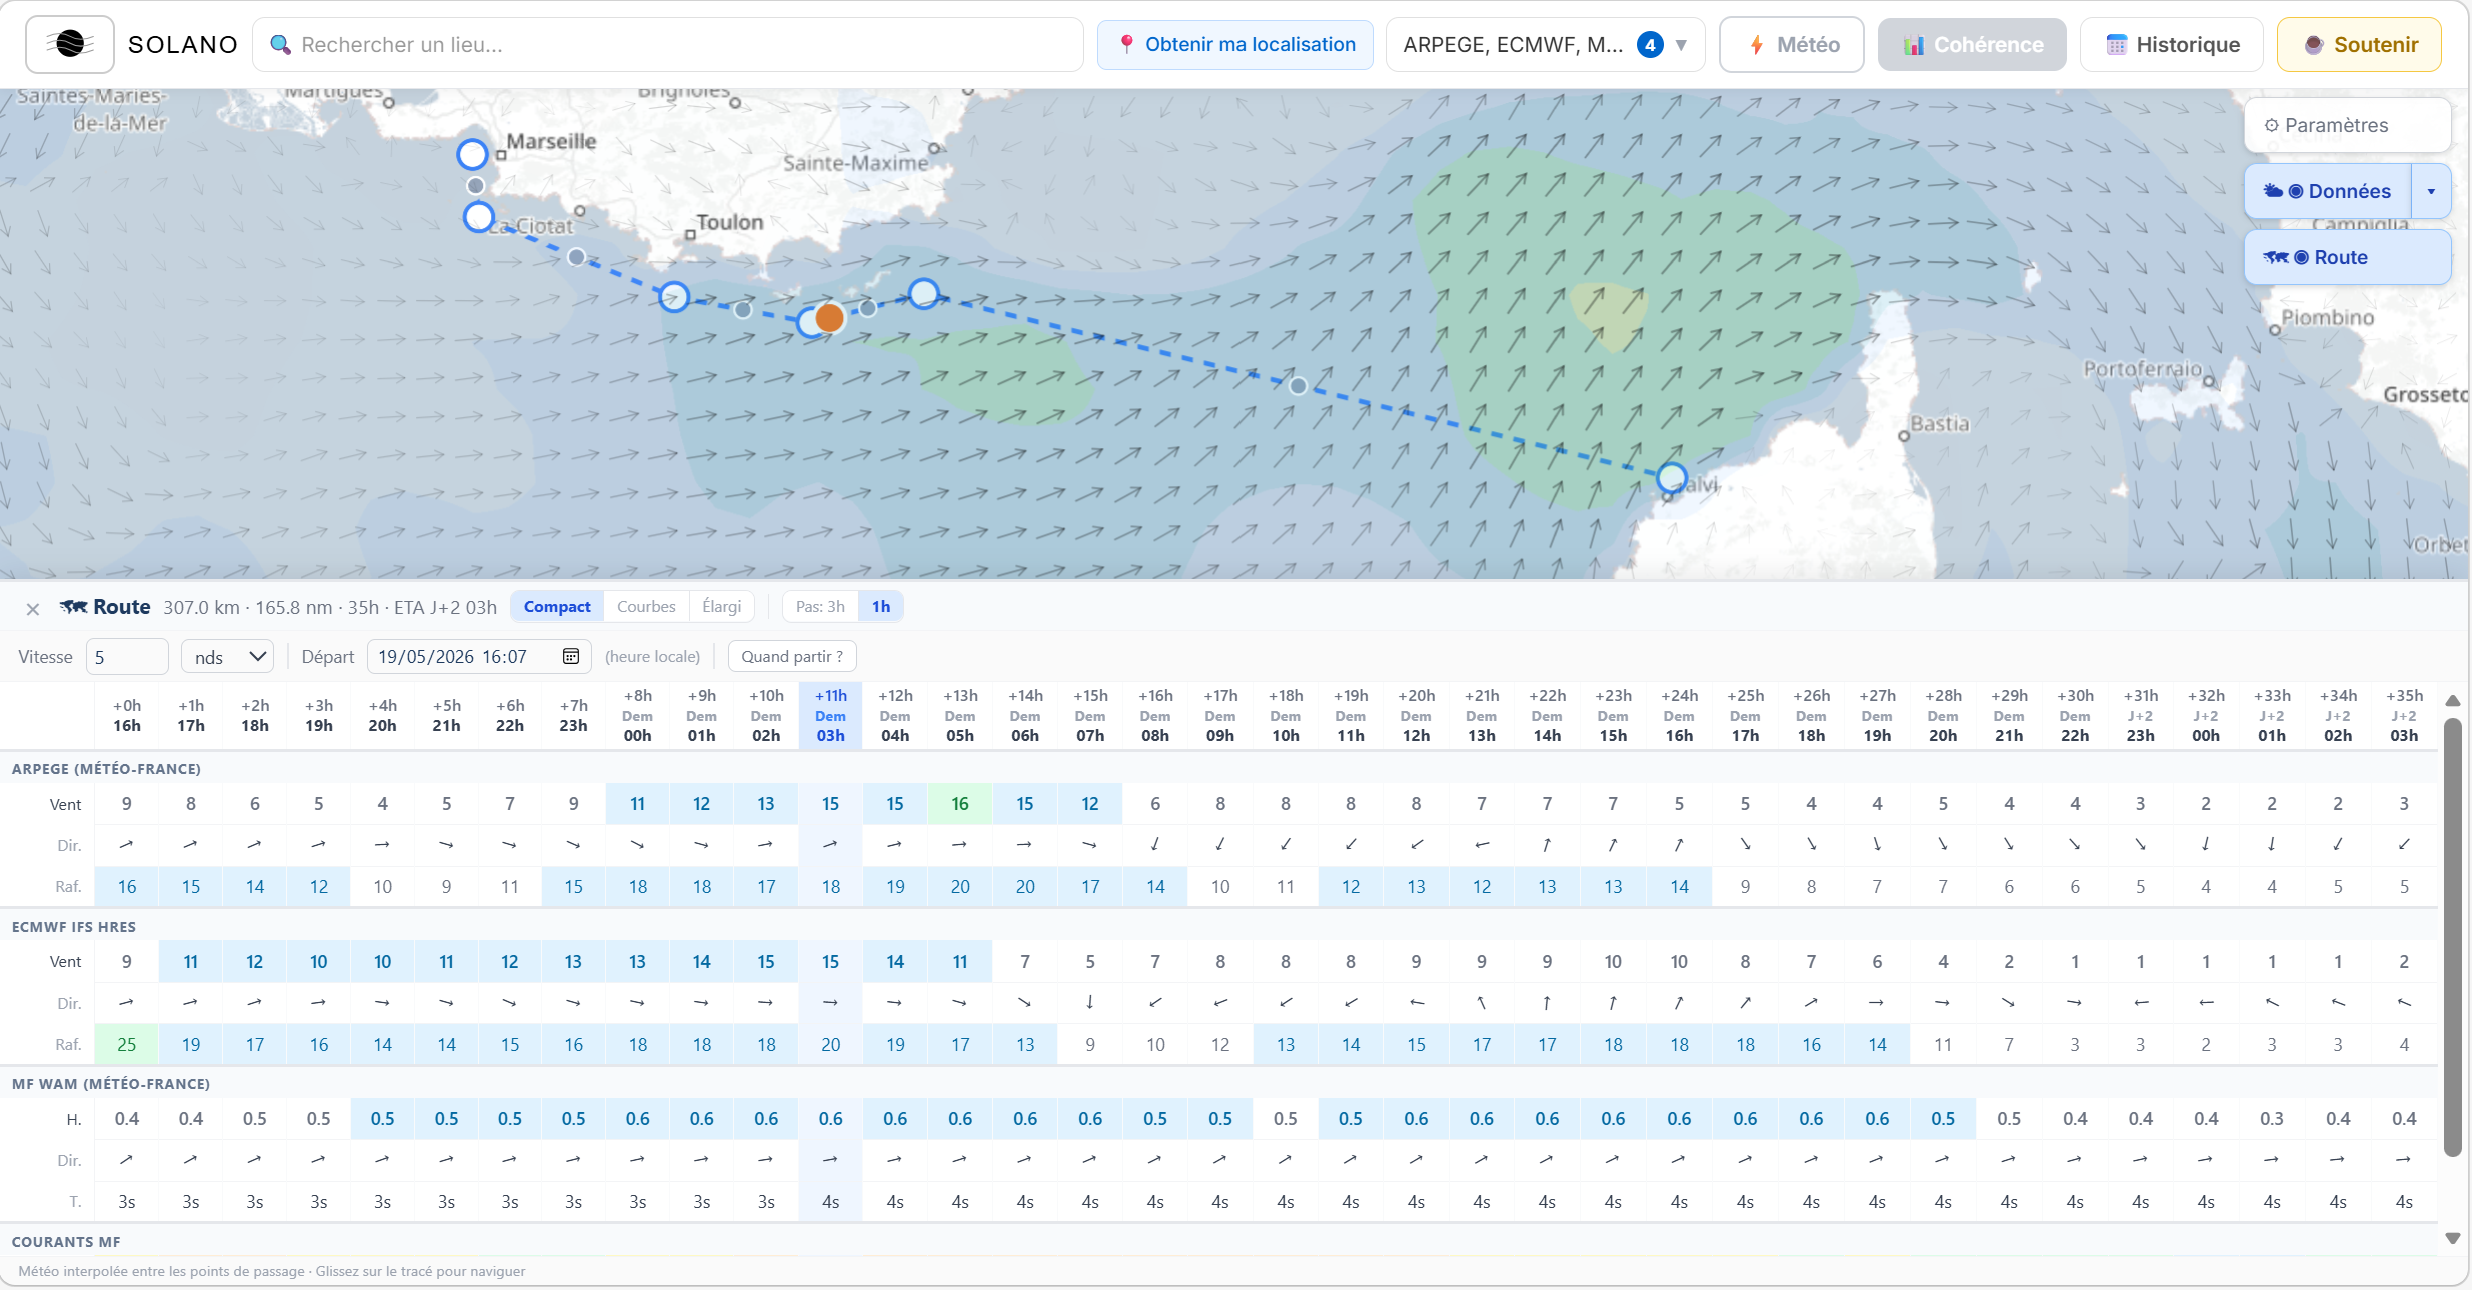
Showing the speed and departure-time fields in the panel.
Importing a track prepared elsewhere
If you route with another program — qtVlm, OpenCPN — you can bring its itinerary into Solano: the "📁 Routes" menu offers "📥 Import a track (GPX / CSV)". GPX is the preferred format, the one these programs export natively, with the route name; CSV is accepted for spreadsheet exports (two columns, latitude and longitude).
A very detailed route is simplified to 200 points, keeping the start and finish, so the table stays readable. The imported track then becomes an ordinary Solano route: you can save it, associate it with a logbook voyage and freeze its forecasts for the passage.
3. The two weather views
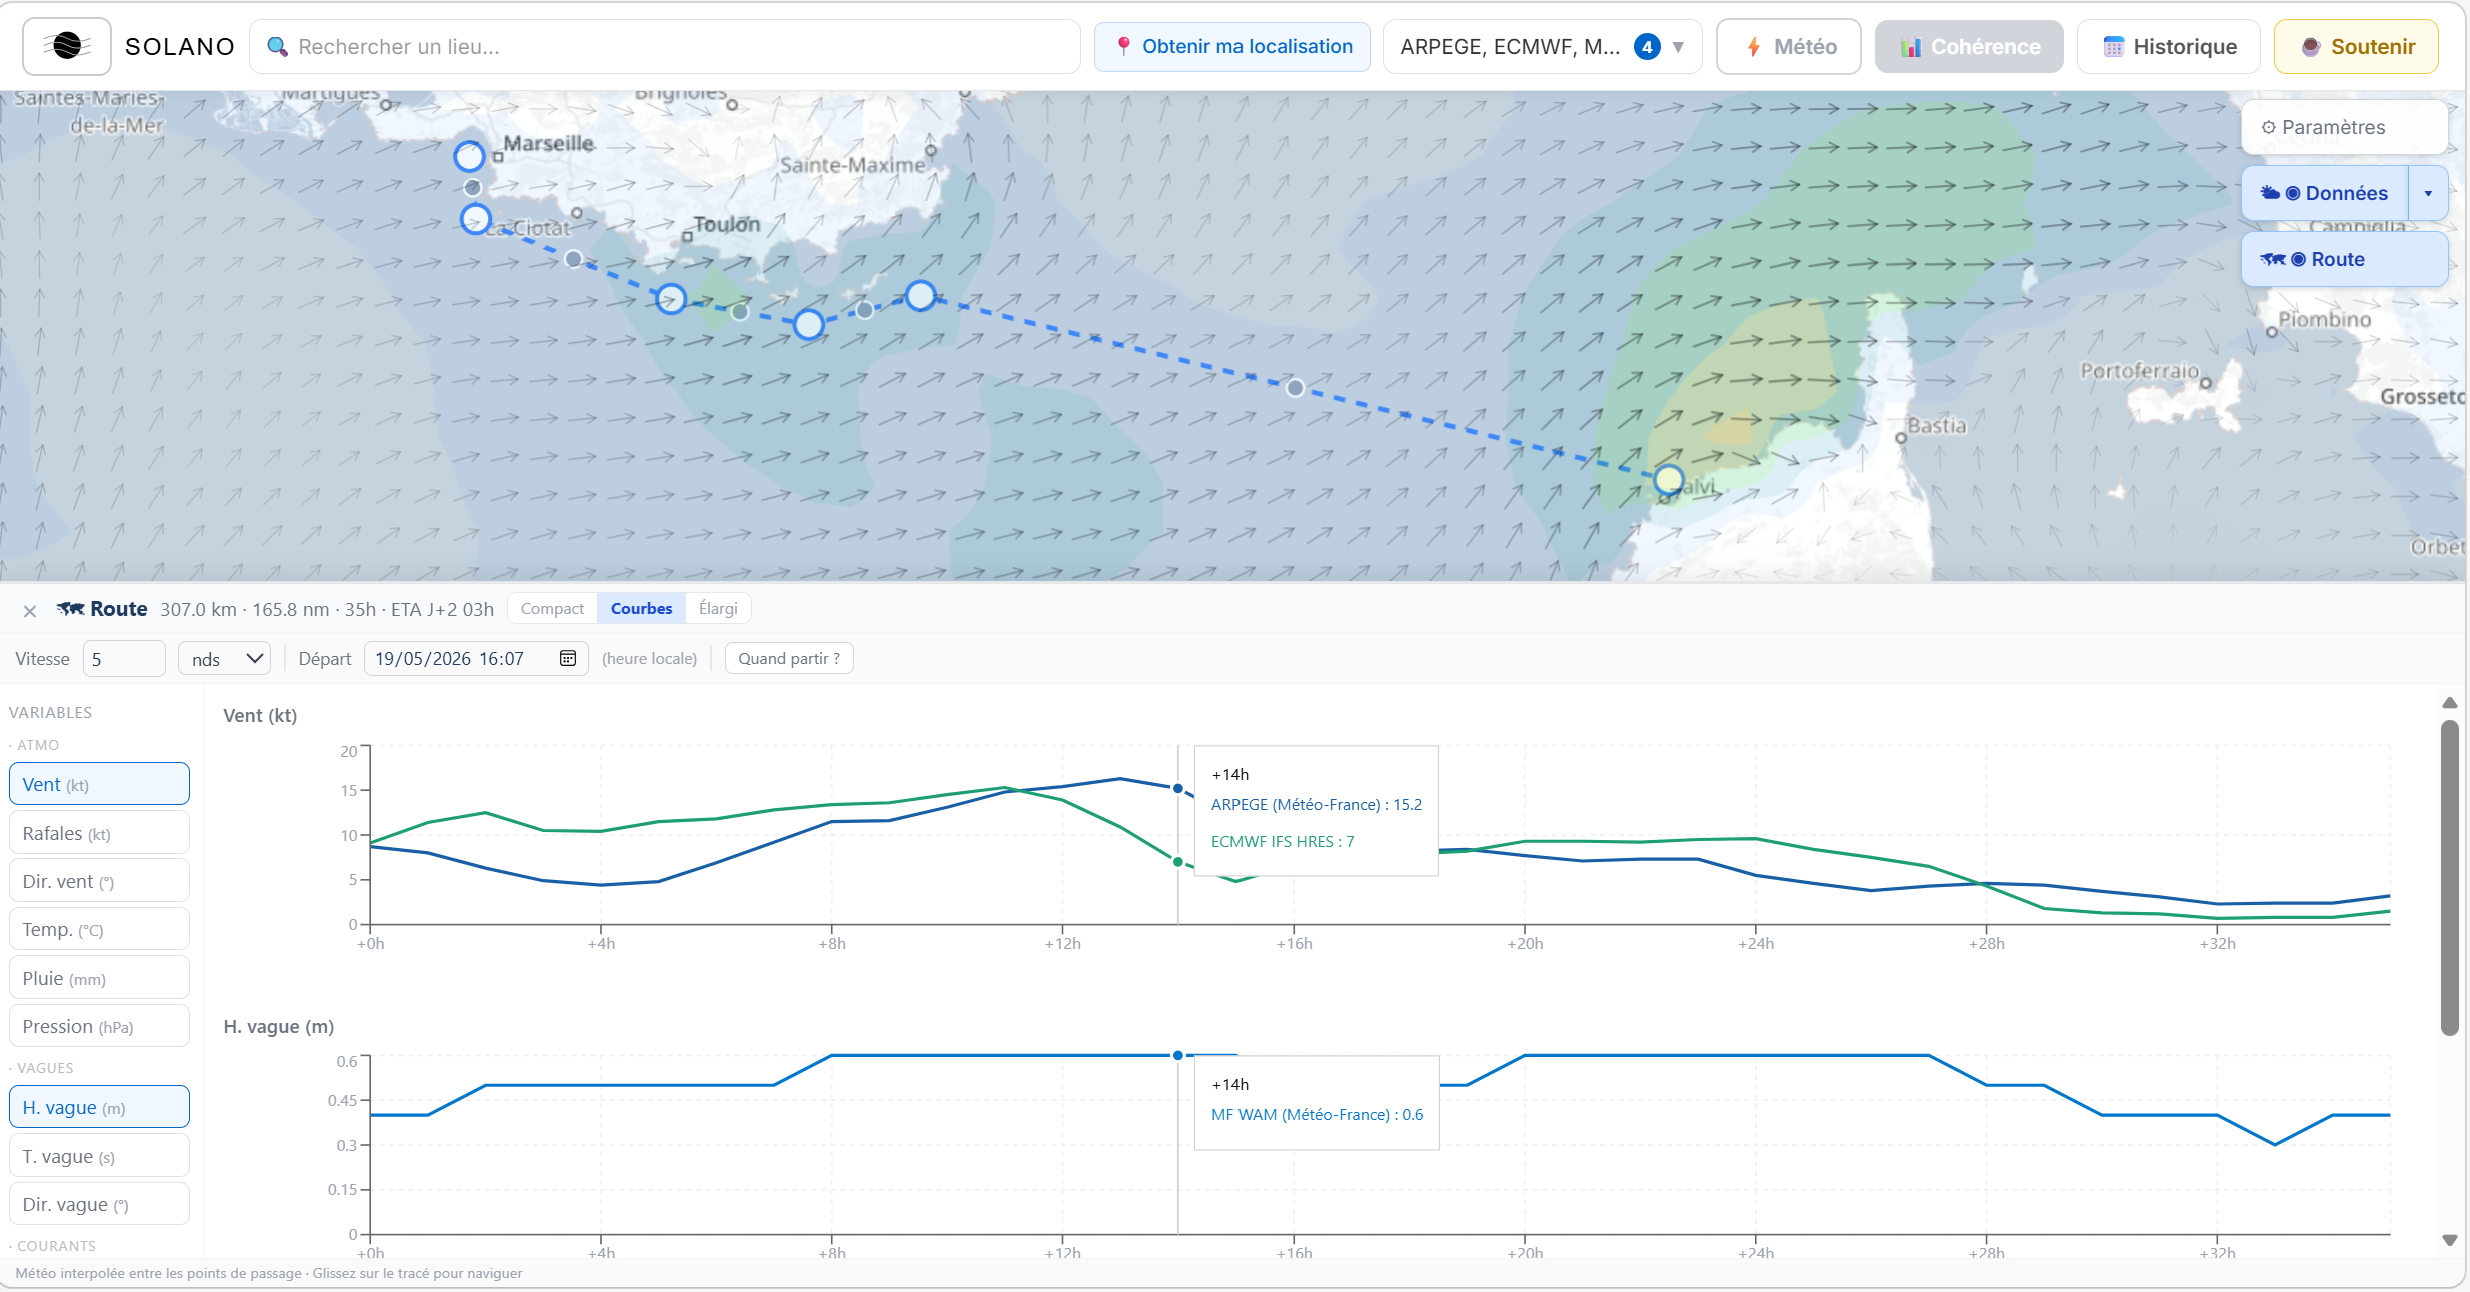
The Trip Weather panel offers two ways to read the weather along your itinerary, with a toggle at the top of the panel. Next to them, the passage table (“⛶ Passage table” button) unrolls everything hour by hour, one model at a time.
The "Thunderstorm risk" band along the track
Above the table, a thunderstorm band sums up the convective risk all along the route. It reads from left (departure) to right (arrival): one coloured cell per computation point, evaluated at the position and the time the boat will be there — not an illegible point-by-point grid. The expandable detail lists the at-risk points with their ingredients (CAPE, CIN inhibition, Lifted Index, shear, lapse rate) and flags "loaded gun" situations. The index is anchored on GFS, regardless of the models displayed; the full mechanism is described in the thunderstorm-risk method.
4. When to leave? — finding the best window
One of Trip Weather's most useful functions. The "When to leave?" button in the control bar starts an automatic analysis: Solano computes a score out of 10 for 13 candidate departure windows — from 6 hours before to 30 hours after the currently configured departure, in 3-hour steps — and displays them in chronological columns.
Choose your activity
Select your activity via the toggle in the control bar before starting the analysis:
- ⛵ Sailing — wind optimum 10–15 knots (dead calm penalised because there is no progress), sea comfort combining wave height and period, wind angle to heading valued
- 🚢 Motoring — light wind preferred (0 knots = 10/10), same sea comfort, no direction bonus
- 🚴 Cycling — increasing wind penalised, tailwind valued, rain and temperature included
- 🥾 Hiking — rain and temperature dominant, wind taken into account for exposure
For each candidate, Solano shows the key parameters according to the chosen activity: mean and max wind, gusts, direction, CAPE for sailing and motoring; wave height for sailing; rain and temperature for cycling and hiking. These values are given as mean and maximum over the whole route.
The score criteria
For each candidate window, the score includes — depending on the activity — :
- Wind and gusts — thresholds suited to the activity
- Sea state (sailing/motoring) — the height × period combination: a 1.5 m sea at 3 seconds is much harder than a 1.5 m swell at 12 seconds
- Wind direction relative to the heading (sailing/cycling) — a beam to close reach is ideal for sailing; a tailwind for cycling
- Sailability — the share of the trip actually feasible under sail (see below)
- Convective CAPE risk — included in every activity, heavily penalised above 800 J/kg
- Rain and temperature (cycling/hiking)
Will you have to run the engine?
A window where you motor is not a good sailing window, even if the sea is fine and the sky clear. So Solano examines each hour of the trip and works out whether you can make way under sail. Two cases prevent it:
- The wind is head-on — the angle between the route and the wind is less than 35°. You'd have to tack, which lengthens the route, or motor.
- The wind is too light for the point of sail. The threshold depends on the point of sail, because apparent wind moves the opposite way: close-hauled, boat speed adds to the true wind and you make way in little air; downwind, the boat runs away from the wind, apparent wind falls, and you need more of it. Solano keeps 5 knots close-hauled and on a reach, 8 knots downwind, with a gradual transition between the two.
The share of sailable hours feeds into the score, and the result is shown next to it: "🔧 40 % (light air)" or "🔧 40 % (head to wind)" depending on the dominant cause. You immediately see that a window otherwise well rated will have you motoring nearly half the time.

5. Atmospheric and marine models
The models to use for Trip Weather are selected from the TopBar (the selection bar at the top of the screen), not from the Trip Weather panel itself. You can turn each model on or off independently.
The display order in the Trip Weather panel follows a fixed logic:
- Atmospheric models — wind, gusts, direction, rain, temperature
- Wave models — significant height, period, direction
- Current models — speed and direction of surface currents
Solano automatically detects whether your route is on land or at sea. Marine models are only shown if at least one waypoint is actually at sea — even if you selected them in the TopBar. A Clermont–Lyon route will never show MF-Wam, whatever the selection.
5a. On foot: elevation profile and walking time
When the activity is hiking (🥾), Trip Weather takes the terrain into account. Solano reads the track’s altitude every 100 m (a digital terrain model of about 90 m), and shows the profile, the ascent / descent and the duration with climbing next to the duration on the flat.
Walking time follows Tobler’s rule: speed depends on the slope at each spot (slower uphill, slightly faster on a gentle descent, braked on a steep one), scaled so your flat-ground speed stays the one you entered. Since the time of passage is known at every point, the weather is read at the time you are really there, not at the time of a constant-speed trip.
The walking table gains an Alt. column and, when the model provides it, the 0 °C level (❄ when you are above it: it is freezing where you stand). The temperature shown is already the one at the point’s altitude. The thunderstorm banner states the hour of peak risk.
Limits: a 90 m terrain model smooths narrow ridges, so the ascent of sharp summits is slightly underestimated; and a track drawn as a straight line between two points cuts across switchbacks, which underestimates the distance.
6. What to keep in mind
- The weather is interpolated, not computed point by point. Between two waypoints, values are interpolated linearly — local effects (acceleration under a headland, the lee of an island) are not modelled. Knowing your route remains essential.
- Speed is constant. The calculation assumes an identical travel speed over the whole route. If you wait in an anchorage or sail more slowly to windward, the arrival times at the waypoints will shift.
- Trip Weather does not replace serious preparation. It complements point-by-point weather analysis — it does not replace it. Cross-checking with official marine bulletins (Météo-France, CROSS) remains essential for any outing at sea.
- The "When to leave?" scores are indicative. The thresholds used are calibrated for standard conditions according to the activity. They do not account for your boat, your experience, or the specific constraints of your itinerary.