1. Why look at climatology?
Short-term forecasting answers "what weather tomorrow?". Climatology answers a different question: "is what I'm seeing normal for the season?"
A mean wind of 18 knots in July over the Gulf of Lion may be ordinary (it's the month of the mistral) or surprising (if you're used to a calm July). Without a historical reference, it's hard to know whether the current situation is exceptional or ordinary.
Solano's climatology brings this context in two levels:
- The ERA5 monthly averages — what this place has experienced on average over the last 40 years, month by month
- The SEAS5 seasonal trends — what the models predict for the coming months on a large scale (above/below/close to normal)
2. ERA5 and SEAS5: two complementary sources
3. The ERA5 monthly averages
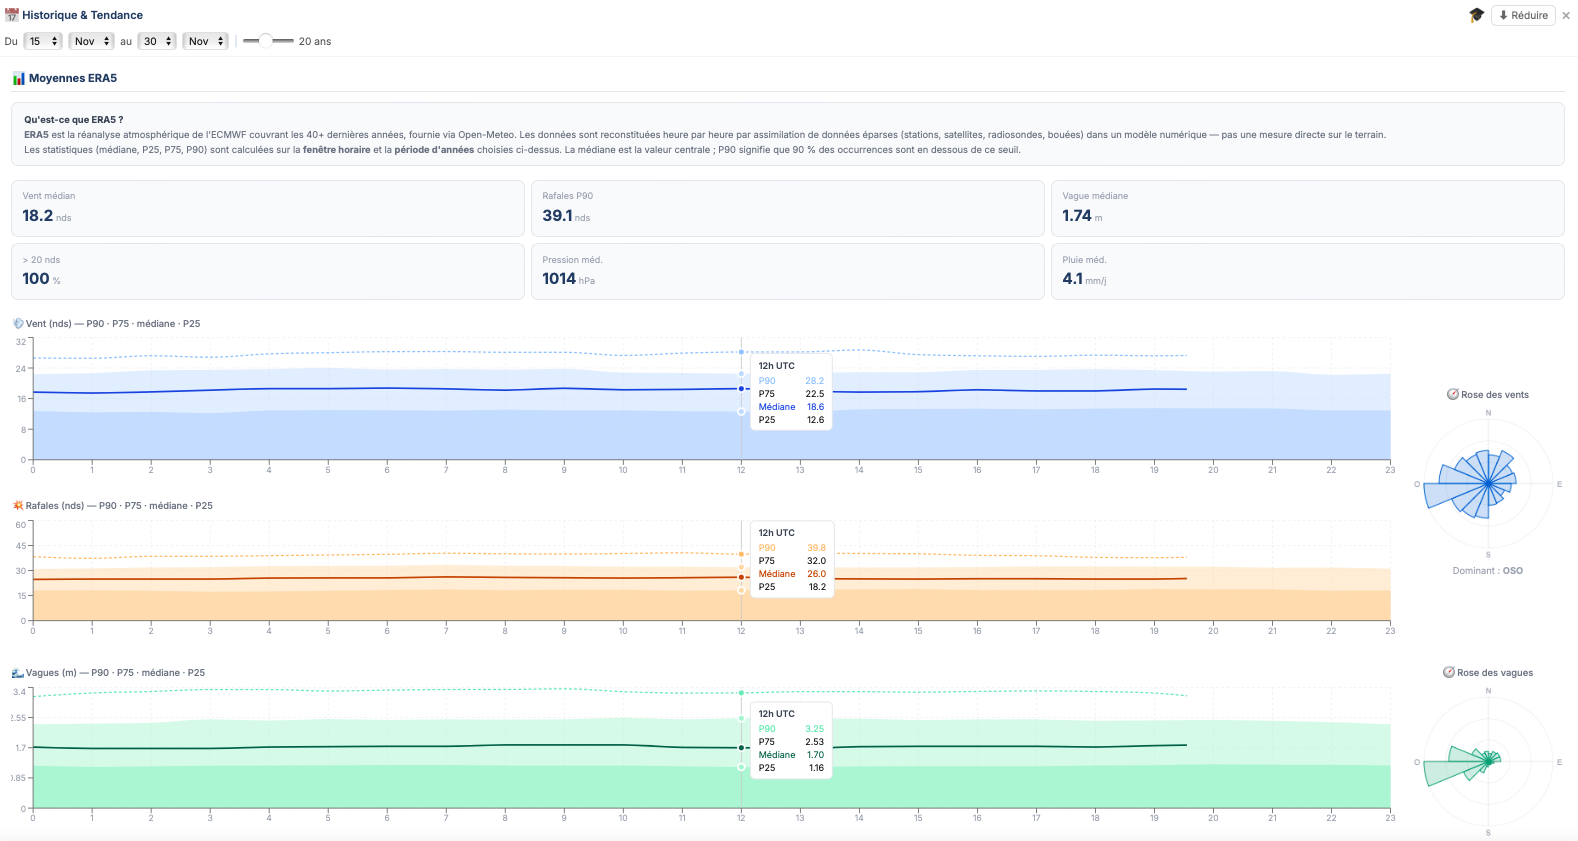
The Climatology panel shows, for the selected point, the monthly historical averages computed on the ERA5 archives. For each month of the year, you see:
- The mean wind and the typical gusts for the month
- The average monthly rainfall
- The average temperature
- The average wave height (for points at sea)
These values are shown as monthly charts. The current month is highlighted, and the value predicted by the short-term models is overlaid to allow a direct comparison.
4. The SEAS5 seasonal trends
The SEAS5 section of the Climatology panel shows the probabilistic trends for the coming months. This is not a precise forecast but a statistical signal: will the forecast conditions probably be above, below or close to the historical normal?
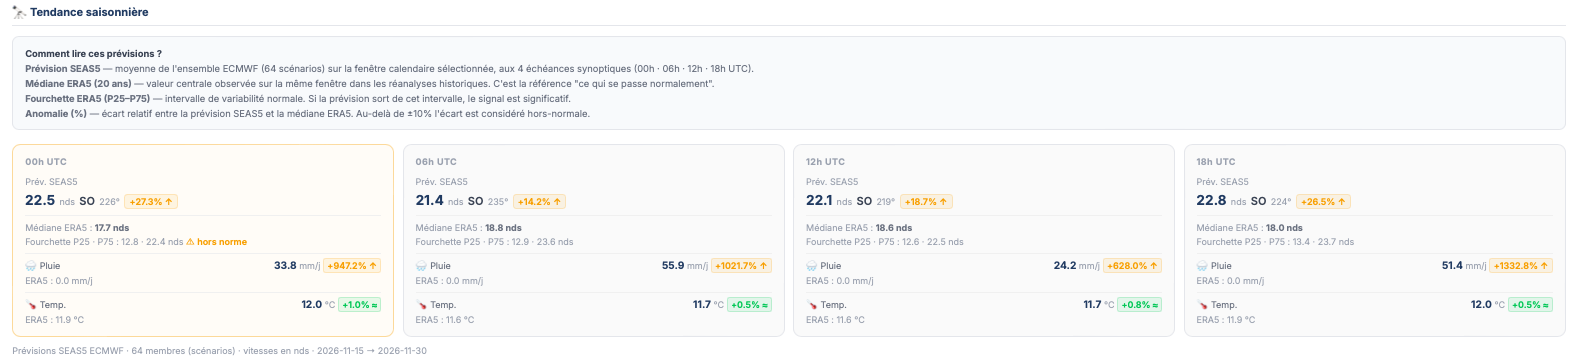
The SEAS5 trends are particularly relevant for:
- Planning a sailing season — a spring forecast "above normal for wind" suggests a more active season than usual
- Anticipating anchorage conditions — a summer forecast "below normal for precipitation" is a signal of potential drought for coastal areas
- Calibrating expectations — a "normal" signal on waves in July doesn't allow a conclusion, but a strong "above" signal is worth attention
5. Available variables
| Variable | ERA5 monthly | SEAS5 trends | Marine points only |
|---|---|---|---|
| 💨 Mean wind | ✓ | ✓ | — |
| 💨 Gusts | ✓ | ✓ | — |
| 🧭 Wind direction | ✓ | ✓ | — |
| 🌧️ Precipitation | ✓ | ✓ | — |
| 🌡️ Temperature | ✓ | ✓ | — |
| 🔵 MSL pressure | ✓ | ✓ | — |
| ☁️ Cloud cover | ✓ | ✓ | — |
| 🌊 Wave height | ✓ | ✓ | ✓ |
| 🌊 Wave period | ✓ | ✓ | ✓ |
| 🌊 Wave direction | ✓ | ✓ | ✓ |
Marine data (waves) is only shown for points detected as being at sea. On a land point, only the atmospheric variables are available.
6. What climatology does not tell you
- Climatology is not a forecast. ERA5 describes what happened on average — not what will happen. An average of 12 knots in July does not mean every day of July will be at 12 knots.
- SEAS5 gives probabilities, not certainties. An "above normal" signal on wind means that scenario is statistically more likely — it may not materialise.
- Spatial resolution is limited. ERA5 and SEAS5 work at resolutions of several kilometres. Local effects (a deep valley, an exposed promontory, coastal acceleration) are not captured in the climatology.
- Climate change biases the averages. The ERA5 averages fold in 40+ years of data. The most recent years, warmer and potentially more disturbed, may already depart from the long-period average computed.